
The measurement of large-scale structure using data from the SDSS or other large optical surveys is fundamentally limited by the accuracy to which the brightness, surface brightness and colors of galaxies and quasars can be measured. The SDSS is making a major effort to ensure that the survey photometry is of high accuracy, as described in Chapter 9, and is also working towards the high accuracy measurement of the interstellar extinction and reddening. Spectroscopic target selection will be done on photometric quantities which are, as far as possible, corrected for Galactic extinction and reddening, to enable the selection of a sample which is complete outside the Galactic extinction layer. Further, as discussed in Section 3.1, we expect to be able to use the photometric data alone for galaxies fainter than the spectroscopic limit to derive photometric redshifts, galaxy counts, and information on galaxy evolution and large scale structure, and therefore need a good knowledge of the distribution of Galactic extinction.
The SDSS takes a twofold approach to measuring the interstellar extinction. First, we will calculate an a priori reddening/extinction map as accurately as possible from existing information. Second, the photometric data from the SDSS itself will be used in a variety of ways to measure the extinction in the survey area. These two extinction maps will be compared continuously as the survey progresses and the results used to calculate the extinction as a function of wavelength and of position on the sky, to be used during the target selection process and in subsequent analysis. The result of this effort should be not just an improved (we hope) high-latitude extinction map, but a large data set on the properties of the diffuse interstellar medium which should itself yield a good deal of useful and interesting science. As the discussion below will show, the composition, makeup and extinction properties of the diffuse interstellar medium vary across the sky at a level which is significant compared to the target 1% systematic accuracy of the SDSS photometry.
The next section describes the motivation for this effort, focusing in particular on the selection of quasars and galaxies as spectroscopic targets and the effect of extinction on applications of the SDSS data to analyses of large-scale structure. Section 3.7.3 describes existing data on the interstellar extinction at high latitudes, and Section 3.7.4 the use of the SDSS data, in particular for "reddening standard" stars, to measure extinction. Section 3.7.5 briefly mentions some of the interstellar medium science which might result from the SDSS extinction map and its comparison with other measures of the diffuse interstellar medium.
Maps of the interstellar medium column density across the sky, made using emission in the HI line or emission from dust in the diffuse medium, show that the distribution is fairly patchy. This is bad news for large-scale structure studies, which one way or the other are concerned with the patchiness in the angular distribution of extragalactic objects. For example, Nichol and Connolly (1996) show that the distribution of galaxy clusters from the Abell (1958) catalogue anti-correlates with the HI column density (Stark et al. 1992). To assess the impact of structure in the extinction, we have examined its effect on measurements of the galaxy power spectrum (Vogeley and Connolly 1996). This study assumes that the "true" galaxy power spectrum is that given by an Omegao = 0.3 CDM model. The reference sample from this simulation is a volume-limited sample of the North Galactic Cap region of the SDSS to a depth of 500 Mpc/h, the approximate depth for L* galaxies selected at r' = 18.2 (Section 3.1). This investigation also assumes that the extinction curve and gas-to-dust ratio are everywhere the same, i.e. that the extinction in the survey bands has the same constant of proportionality everywhere, as does the ratio of extinction to HI column density. The effect of deviations from this assumption is described in the next section.
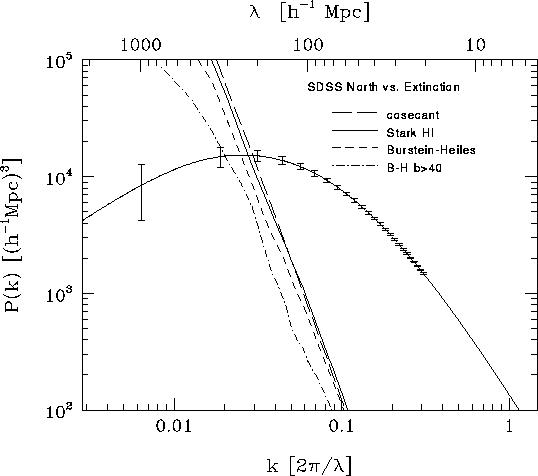
Uncertainty due to extinction. The errors introduced into the power spectrum of the Northern survey by failure to correct for extinction are shown. The model power spectrum is calculated for a volume-limited sample; the error bars are calculated for shot noise and uncertainties due to the sample size. The extra power due to extinction if no corrections are made is shown for various extinction maps (in AB). Cosecant: assuming the Galactic extinction varies as cosecant(b). Stark HI: extinction assumed proportional to HI integrated brightness. Burstein-Heiles: extinction map from Burstein and Heiles (1982). Two models are shown for this last; using the Burstein-Heiles maps for the whole northern area, and for b>40°.
Were the measurements perfect, the accuracy of the measurement of the power spectrum would be limited by shot noise (the finite sampling density of the galaxies) and by cosmic variance (the finite size of the survey volume) (Feldman, Kaiser and Peacock 1994). The resulting error bars are shown in the model power spectrum in Figure 3.1.9, which is computed assuming perfect photometric data.
Figure 3.7.1 shows the contribution to the power spectrum as measured by a distance limited sample if we do not correct the selection function for extinction, using various measurements of or approximations to the distribution of Galactic extinction. The power spectrum measurement is limited to scales < 300 Mpc/h and, in particular, we cannot reliably measure the turnover scale of the power spectrum.
Two of the extinction maps used in producing Figure 3.7.1 are those of Burstein and Heiles (1982), calculated from galaxy counts and HI integrated brightnesses; and an extinction map calculated from the HI integrated brightnesses measured by Stark et al. (1992) using a constant extinction to HI ratio. The offset between these two power spectra is likely due to a small calibration error in the HI/extinction relationship. We can use this offset to illustrate the value of making an a priori extinction correction. Figure 3.7.2 shows the residual extra power after correcting for extinction with an estimated map. We assume that the true extinction is described by the Burstein-Heiles map but that we corrected using the scaled HI map. Even with this crude correction, the extra power drops by at least an order of magnitude, and extinction is now a limiting factor only for scales larger than about 700 Mpc/h, with the power spectrum turnover now measurable. As the offset in Figure 3.7.1 shows, we could clearly do a better job on the existing extinction maps, and should be able to measure the turnover wavelength with confidence.
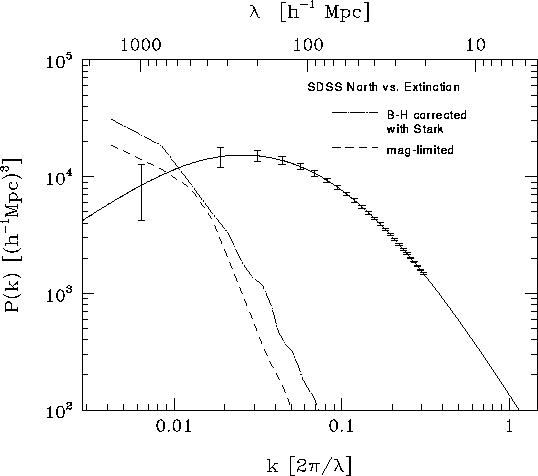
Effect of correcting for extinction. The power is calculated assuming that the extinction is correctly described by the map of Burstein and Heiles (1982) but that the SDSS data have been corrected using the scaled HI brightness from Stark et al. (1992). Even this crude correction reduces the effect of extinction on a volume-limited sample by an order of magnitude. Also shown is the extra power due to mis-corrected extinction for a magnitude limited sample.
What about random uncertainties on smaller scales? Figure 3.7.3 shows the effect of photometric zero point errors of 0.1m (due to extinction or calibration errors) on the 3° and 6° scale. The extra power due to these uncertainties is well below the expected power out to 1000 Mpc/h. Figure 3.7.3 shows that, if we can determine the extinction to ~ 10% in each 3°x3° patch, we can reliably measure the power spectrum.
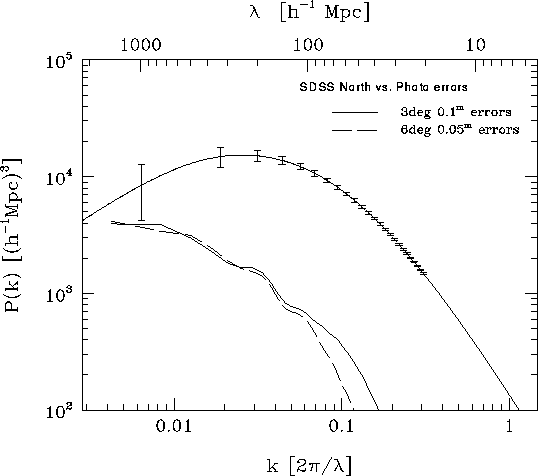
Effect of small-scale fluctuations in extinction. The power due to scatter in the photometric zero-point errors of 0.1m per 3°x3° field and 0.05m per 6°x6° field are shown.
Figures 3.7.1, 3.7.2 and 3.7.3 illustrate the very important point that the largest scale accessible to the SDSS is limited by its internal photometric zero point accuracy across the survey area. To observe the power spectrum turnover or probe the COBE scale, any systematic gradient must be < 0.1m across the Northern survey area.
The differential extinction, or reddening, is characterized by the ratio of the total to selective absorption R = AV/EB-V . Extinction curves measured along different lines of sight are found to have approximately the same shape for wavelengths longer than about 5000 Å, but differ at shorter wavelengths, with values of R ranging from 3 - 5, indicating spatial variations in the size distribution and composition mix of grains (Cardelli, Clayton and Mathis 1987; Fitzpatrick and Massa 1988). This variation can also be seen in maps of the emission from diffuse high-latitude dust made by IRAS (Guhathakurta and Tyson 1989; Cutri and Latter 1994; Cutri and Guhathakurta 1996).
Figure 3.7.4 shows the interstellar extinction curves for several values of R from Cardelli, Clayton and Mathis (1987) compared with the wavelength ranges of the SDSS filters. The selection of the galaxy spectroscopic sample, based as it is on r' flux densities (cf. Section 3.1) is likely to be unaffected by spatial variations in R. The maximum large scale extinction in the SDSS survey area is ~ 0.2m (Figure 5.1), and the maximum effect on the observed value of g' - r' due to variations in the extinction curve is ~ 0.02m , negligible for the selection of luminous red galaxies (Chapter 3.2). The maximum effect on the u' - g' color, however, is about 0.05m , which may affect the quasar selection in the `skirt' region (Chapter 3.3).
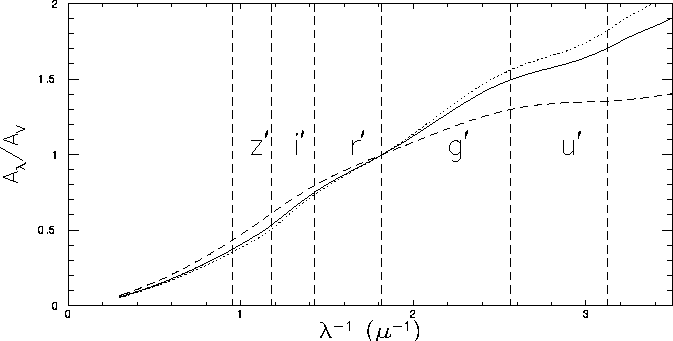
Interstellar extinction curves. Curves are shown for R = AV/EB-V = 2.75 (dotted line), 3.1 (solid line), and 5.0 (dashed line), normalized to AV = 1. The approximate wavelength boundaries of the SDSS filter set are shown by the vertical dashed lines.
The Northern SDSS survey is therefore located within the minimum extinction boundaries as defined by the HI surface brightness, extinction from galaxy counts and 100 - 200 µm emission measured by IRAS and COBE. The survey footprint, and the proposed photometric stripes, are described in Chapter 5 (Figure 5.1).
The selection of spectroscopic targets will include the prediction of the extinction in each of the five SDSS filters at the position of each object. This will be done by using a map derived from existing data, which gives the extinction in the B band, and calculating the extinction in u', g', r', i', and z' by convolving the SDSS filter functions with the R = 3 extinction curve (Figure 3.7.4).
Providing this reddening map has been straightforward, thanks to the generosity of our colleagues. At present we have in the SDSS data base the five extinction maps calculated as described above from a digital copy of the Burstein-Heiles (1982) maps provided by D. Burstein, and are in the process of installing a second map provided by D. Finkbeiner, D. Schlegel and M. Davis, U.C. Berkeley (Schlegel 1995). The Burstein-Heiles map is calculated from HI line integrated brightnesses, scaled to extinction using the Shane-Wirtanen galaxy counts. The second is calculated from dust column densities found from the COBE/DIRBE maps at 160 µm and 240 µm , also scaled to extinction using APM galaxy counts. Direct measurement of the dust column density is preferable to indirect measurements from, say, HI integrated brightnesses because of the possibility of significant HI optical depth and/or some of the hydrogen being in molecular form, although the 160 µm emissivity is a fairly strong function of temperature; cf., the discussion in Schlegel (1995). The two maps are fairly similar, but the COBE maps find regions of significant extinction where the HI emission appears to be susceptible to the above effects. Both maps have resolutions of order 1°.
As the discussion in the previous subsection shows, these maps should estimate the extinction well enough to allow the measurement of very large-scale power by the SDSS. We plan to attempt improvements to the input extinction to improve measurements of the large scale structure further before the survey starts, using additional data bases. This map will be incorporated into the SDSS data bases and used (in conjunction with extinction data derived from SDSS photometry, see below) during spectroscopic target selection. The map serves a second function: it incorporates in easily-usable form the available data on the large-scale distribution of the different components of the interstellar medium, making scientific analyses more straightforward.
The IRAS sky maps measure diffuse dust emission with higher angular resolution ( ~ 3' - 5' ) than the COBE/DIRBE data, but are not directly usable because (1) the calibration of the IRAS 100 µm maps of diffuse emission is uncertain (2) the longest IRAS wavelength, 100 µm , is shortward of the peak emission from interstellar dust (whose temperature is typically 18 K), and (3) the emission at the shorter IRAS wavelengths (12 µm , 25 µm and even 60 µm ) is partly contributed by transiently heated small grains. If the IRAS 100 µm map can be converted reliably into dust column densities, it will provide, in addition to higher spatial resolution, the opportunity to compare dust column densities with extinction and reddening measurements of individual high-latitude objects (blue halo stars, globular clusters, RR Lyrae stars etc.) because of this higher spatial resolution.
The finally-processed IRAS maps (co-added, destriped etc.) have been in the public domain for a while now in the form of the IRAS Sky Survey Atlas (ISSA). We will smooth these to the COBE/DIRBE resolution to check and calibrate the flux density scale, median filter them at this resolution to remove strong point sources, and then attempt to construct a full resolution dust column density map. These maps can be produced either by assuming a constant dust temperature of 18 K or by using the mean temperatures from the COBE/DIRBE map. If this can be done reliably, comparison with filtered maps at the shorter IRAS wavelengths may allow an investigation of changes in the grain mix and temperature along different lines of sight. The extinction measures can be calibrated by comparison with galaxy count data and with reddening measurements of hot halo stars (Danly et al. 1992; Diplas and Savage 1994).
The main cause for concern in high resolution maps is the presence of regions of high extinction at high galactic latitudes. Small molecular clouds are common at these latitudes (Magnani et al. 1996) and have extinctions of up to 2m on scales of arminutes to a degree or so. The extinction patchiness and contrast produced by these clouds is underestimated at the COBE and HI resolutions, and its effect is likely to be similar to that of bright stars, which "punch holes" in the observed galaxy surface density because faint galaxies cannot be found (see, for example, Figure 12.2). As long as we know about such regions, they can be taken into account during analysis, as described in Chapter 3.1 - cf. also Figure 3.7.3. These regions will show up a priori most clearly in the IRAS 100 µm map.
We also plan to look, once again, at the HI/extinction/reddening correlations (illustrated in Figure 3.7.5) using the new HI data of W. Burton and D. Hartmann (Hartmann 1994). HI correlates well with both extinction/reddening and with dust emission (Burstein and Heiles 1982; Boulanger and Pérault 1988). The new HI data are superior to previous all-sky surveys in angular resolution, linearity and removal of stray radiation. HI emission is not an entirely reliable indicator of total interstellar column density, even at high galactic latitudes, because of finite optical depth and the conversion of atomic to molecular hydrogen, but it is far and away the best-measured tracer of the diffuse interstellar medium available to us, and we should understand its use, and limitations, as an extinction predictor as well as possible. The HI/extinction/reddening relationships so derived can be compared with those from HI and H2 column densities measured using ultraviolet absorption lines in reddened hot stars (Danly et al. 1992; Diplas and Savage 1994).
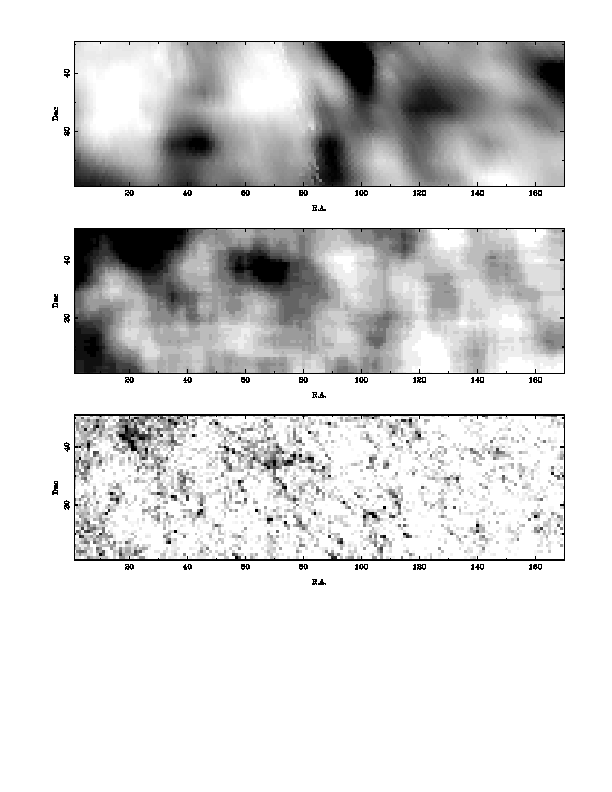
The anticorrelation of HI column density and galaxy counts. The galaxy surface density in the bottom panel is counted to bj = 20.5m . The images are centered on the South Galactic pole and extend from 21.5 to 3.5 hours in right ascension and -20° to -40° in declination. The pixels are 30 arcminutes. The upper figure shows the HI surface brightness from Stark et al. (1992) ranging from 0.91 x 1020 cm-2 (white) to 2.00 x 1020 cm-2 (black). The center panel shows the galaxy counts smoothed to the resolution of the HI data.
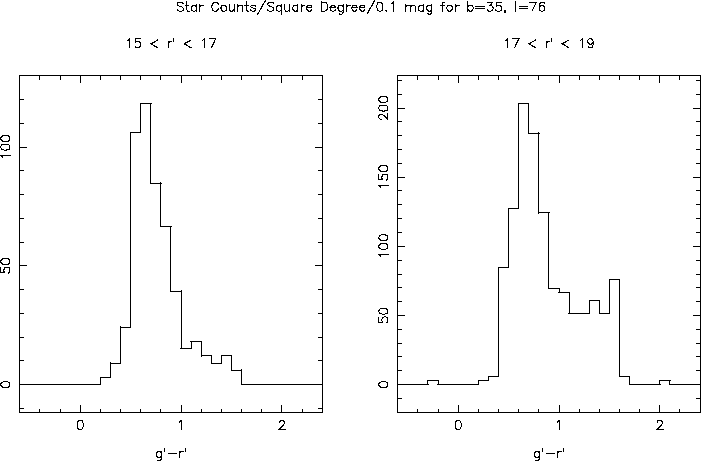
Color distribution for high latitude stars. Data in two magnitude ranges are shown. The data were taken with the FermiLab drift-scan camera through the SDSS filter set using the Apache Point 3.5 meter telescope.
The accuracy of the SDSS photometry is expected to be about 1% in the sensitive bands ( g', r', i' ) and 2% in u' and z' . The SDSS photometric data are accurate enough, and will go deep enough, that we can investigate the reddening in several different ways; using the colors of halo stars and galaxies; galaxy counts; and star counts.
The differential extinction (reddening) can be measured using hot halo stars, (so-called "reddening standards" in the SDSS) which are easily found by their u' - g' colors; we expect 10 - 20 such stars per 3° diameter field of the survey. We expect to measure spectra for them all to confirm their spectral type and to allow the rejection of white dwarfs (and quasars!). The intrinsic colors can easily be computed once the classification is confirmed by the spectra, since these hot stars produce a Rayleigh-Jeans spectrum in the optical with no Balmer jump. A second technique is to measure the g'-r' color distribution of stars as a function of magnitude. By the time we reach magnitude 18m , most of the stars are halo objects, whose color is strongly peaked (Figure 3.7.6), with a width of about 0.3m . The centroid color can be measured to about a tenth of this. The position of the peak will depend on the stellar population, which slowly varies across the survey area due to Galactic gradients, via age and metallicity effects; if these can be calibrated using spectroscopy and models (e.g. the Kurucz models) we will have a powerful technique for measuring the reddening.
It may also be possible to measure the reddening using galaxy colors as a function of magnitude. Although the dispersion in observed colors is large (Figure 3.7.7) the number density of galaxies is likely to be high enough to measure the reddening to about 0.01m on one-degree scales.
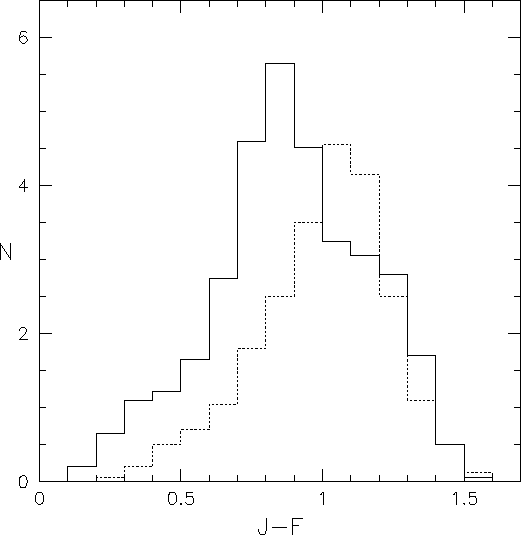
Galaxy color distribution. Data for two intervals of apparent magnitude are shown; the dashed histogram for 16.5 < J < 17, and the solid histogram for 18.75 < J < 19 (the counts are scaled by an arbitrary factor). The data are from Table 13 of Butcher and Oemler (1985). The color J - F is roughly equal to g' - r' .
The total extinction is calculated from the differential extinction by extrapolating the extinction curve (Figure 3.7.4) to lambda=infinity. Here, the comparison with 2MASS data will be very valuable. However, studies of interstellar extinction have always been haunted by the possibility of gray, i.e. color independent, extinction. The only method we have for directly measuring the total extinction is galaxy counts, though this too has its caveats and difficulties. Ignoring for the moment structure in the galaxy distribution, galaxy counts to limiting magnitude mo are observed to scale as:


The galaxy counts show a very slowly-changing power law index (see Table 3.4.1), and so give the extinction in the five survey bands in a straightforward way. The resolution with which galaxy counts can measure reddening is limited by the large scale structure in the galaxy distribution; computations by Loveday (1994) show that galaxy count fluctuations contribute less than 5% at 23rd magnitude (the SDSS limit) on scales of about 1.5°.
We can also calculate the autocorrelation function of the stars as a function of magnitude and color. Stars are supposed to be uncorrelated (though we mention some possible interesting exceptions in Sections 3.5 and 3.6). They are therefore ideal for characterizing the structure in the obscuration, if we can take into account the distribution of the nearer stars within the extinction layer. Gilmore et al. (1985) used the lack of correlation of stars brighter than 18m to set limits on the amplitude of patchy obscuration of EB-V < 0.03m (Figure 3.5.1). The SDSS will go considerably fainter, and we can revisit the method of measuring extinction if we can define the magnitude and color range to minimize the effect of nearby, unreddened stars.
The reliable separation of stars and galaxies to faint limits which the SDSS data set will allow is critical, as is accurate photometry. Comparison of the galaxy counts with the HI column density and the dust column density measured by infrared emission will give the zero point of the galaxy counts, on the assumption that gas and dust co-exist. Finally, the loop can be closed by comparing the total extinction calculated from the reddening measurements of stars with that calculated from the galaxy counts, to check if there is indeed any "gray" extinction, and the reddening can be computed from the galaxy count extinction maps made separately in five colors, and compared with the values gotten directly from star colors.
What could we do with the SDSS interstellar extinction map if we happened to be interested in the interstellar medium? Some analyses of the IRAS and COBE observations have suggested the presence of a large amount of cold (5 K) dust; the normal temperature of interstellar dust is about 18 K. This cold dust emits very weakly, but the extinction and absorption observations described herein detect all of the interstellar dust, and comparison of the SDSS extinction map with the IRAS and COBE maps should provide a definitive answer about the existence of this component. The IRAS maps show wide color variations across the sky: the 100 µm maps see primarily emission from large dust grains (particles a significant fraction of a micron in size) while the 25 µm and 12 µm maps see emission from small grains which are intermittently heated to high temperatures by single photon absorption. The color variations in the IRAS maps therefore probably indicate spatial differences in the grain size distribution. The infrared emission from grains is also affected by local heating sources. Comparison of the IRAS maps with the SDSS extinction maps will allow these effects to be disentangled, and we can investigate whether different IRAS colors for the diffuse emission are related to differences in R in the SDSS reddening map.
The structure of the high latitude medium is filamentary and patchy. This can be attributed to the input to the diffuse medium of mechanical energy from supernova explosions and stellar winds, and the structure can be used to trace the mechanisms for the transfer of mechanical energy to the ISM. Dust is frangible, and is made and destroyed by processes in stars and the interstellar medium. Is the dust size distribution and composition dependent on the structure of the interstellar medium? Are dust grains destroyed by shocks and blast waves? Is dust forming in denser regions? Is it different from dust formed in red giant envelopes? What are the details of the movement of the ISM among the various phases? The accurate map of dust properties provided by the SDSS should provide answers to many of these questions, which are important for considerations of both stellar and galactic evolution.
Abell, G.O. 1958, ApJSuppl 3, 211.
Boulanger, F., and Pérault, M. 1988, ApJ 330, 964.
Burstein, D., and Heiles, C.E. 1982, AJ 87, 1165.
Butcher, H.R., and Oemler, A. 1985, ApJSuppl 57, 665.
Cardelli, J.A., Clayton, G.C. and Mathis, J.S. 1989, ApJ 345, 245.
Cutri, R., and Guhathakurta, P. 1996, in preparation.
Cutri, R.M., and Latter, W.B. 1994, "The First Symposium on the Infrared Cirrus and Diffuse Interstellar Clouds", A.S.P. Conference Series 58.
Danly, L., Lockman, F.J., Meade, M.R., and Savage, B.D. 1992, ApJSuppl 81, 125.
Diplas, A., and Savage, B.D. 1994, ApJSuppl 93, 211.
Feldman, H.A., Kaiser, N., and Peacock, J.A. 1994, ApJ 426, 23.
Fitzpatrick, E.L., and Massa, D. 1988, ApJ 328, 734.
Gilmore, G., Reid, I.N., and Hewett, P. 1985, MNRAS 213, 257.
Guhathakurta, P., and Tyson, J.A. 1989, ApJ 346, 773.
Hartmann, D. 1994, Ph.D. Thesis, Leiden University.
Loveday, J. 1994, SDSS Internal Memorandum.
Magnani, L., Hartmann, D., and Speck, B.G. 1996, ApJSuppl 106, 447.
Nichol, R.C., and Connolly, A.J. 1996, MNRAS 279, 521.
Schlegel, D. 1995, Ph.D. Thesis, University of California.
Stark, A.A., Gammie, C.F., Wilson, R.W., Bally, J., Linke, R.A., Heiles, C., and Hurwitz, M. 1992, ApJSuppl 79, 77.
Vogeley, M., and Connolly, A.J. 1996, "The Impact of Extinction and Photometric Uncertainties on Estimation of the Power Spectrum for the SDSS", SDSS Internal Memo.